Unity profiling tools
Get the information you need to make your game shine. By keeping an eye on your game’s performance profile, you can make sure that the player experience you’ve crafted isn’t tarnished by performance issues. Optimizing your game also helps you target a wider range of platforms and devices.
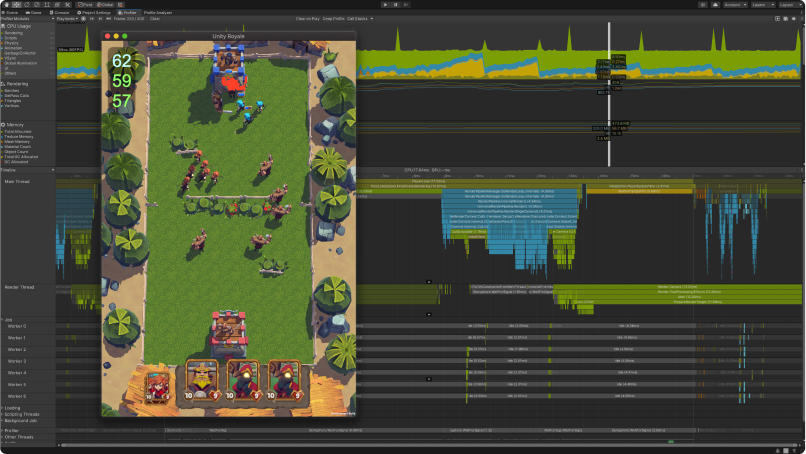
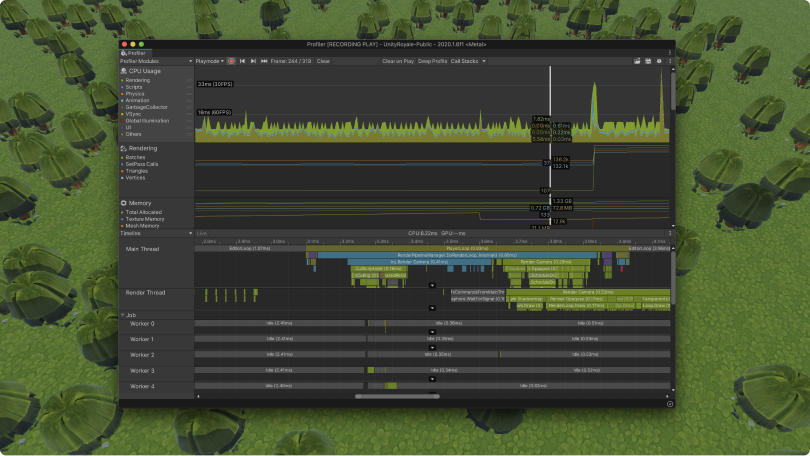
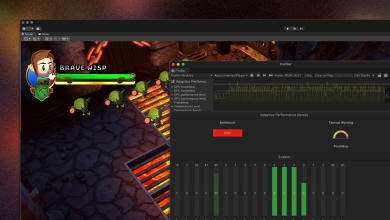
Measure performance with Unity Profiler
The Unity Profiler gathers and displays performance data in a series of charts. This visualization helps you focus your optimization work on the most resource-demanding areas, whether that’s code, audio, physics, animation, or rendering. You can connect it to devices on your network or plugged in to your machine to test how your application runs on the target platform.
Unity Profiler is part of the Unity Editor, and it comes with a low-level native plug-in Profiler API so you can customize your analysis and export profiling data to other tools. See the impact of your changes between a set of Unity Profiler frames with the Profile Analyzer package.
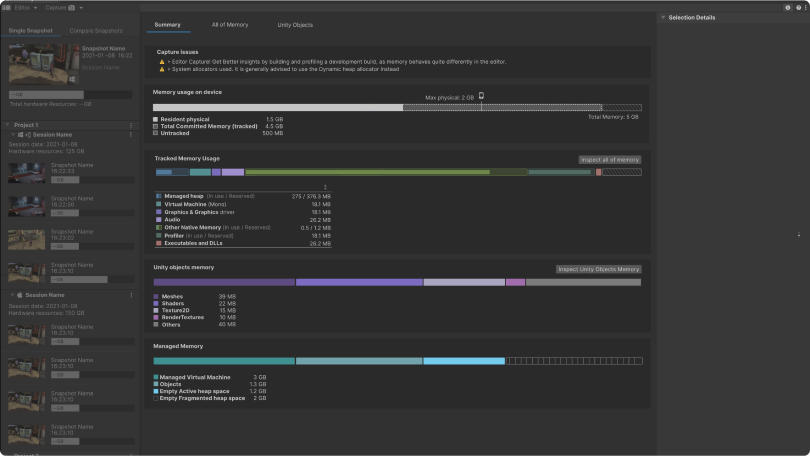
Manage memory with the Memory Profiler
Memory profiling is useful for testing against target hardware memory limitations. It’s also a great tool if you want to improve CPU/GPU performance of your Unity game by making changes that actually increase memory usage. The Memory Profiler is a package that adds a window to the Unity Editor, so you can see memory usage in your application in even greater detail. You can store and compare snapshots to find memory leaks, or see the memory layout to find memory fragmentation issues.
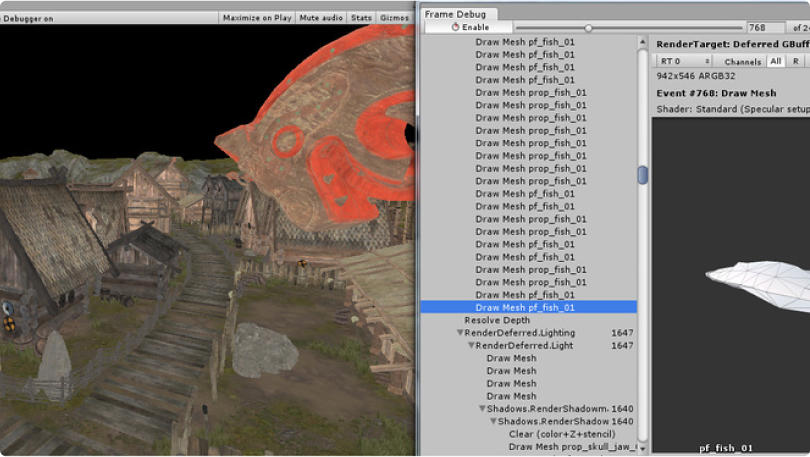
Optimize rendering with Frame Debugger
The Frame Debugger lets you freeze playback for a running game on a particular frame, then view the individual draw calls used to render that frame. You can go through the rendering steps one at a time to see how the scene is constructed from its graphical elements. This enables you to quickly spot what needs fixing or investigate optimization opportunities.
Resources
Start optimizing your Unity games with these resources for experienced programmers.
Ultimate guide to profiling Unity games
We built this 70+ page guide with industry experts. It shows you how to profile an application in Unity, manage its memory, and optimize its power consumption from start to finish.
Games Focus: Profiling and performance optimization
This blog post in our Games Focus series covers the status, upcoming release plans, and future vision for profiling and performance tools and features.

Optimize your mobile game performance
Accelerate Solutions engineers work with top mobile studios to improve player experience. This free e-book collects 75+ of their in-depth tips to help you up your game.
Customizing performance metrics in the Unity Profiler
Extending the Unity Profiler with your own performance metrics enables you to better understand your application’s unique performance story.

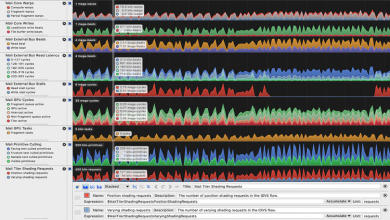
Native CPU profiling
This technical talk for mobile and WebGL game developers walks you through CPU tools, demonstrating how to identify spikes in platform-native profilers.

Documentation
Browse the Unity Manual for in-depth information on how memory in Unity works and how to use the Unity Profiler and other tools.
How to: Profiling and debugging
Get more details on when to use the specific profiling features, including an overview of GPU debugging tools and native tools from companies such as Arm, AMD, or Superluminal.

Best practices: Profiling game performance
This page outlines a recommended general profiling workflow for game developers and includes recommendations for metrics to focus on.

How to: Memory profiling in Unity
This quick, step-by-step overview helps you get started analyzing memory usage in your Unity application.
Frequently asked questions
Keeping an eye on performance and memory throughout your production is critical to providing a quality experience to your players. Profilers collect, analyze and visualize data on how much hardware resources the different elements of your projects use so that you can fix memory and performance issues.
Unity ships with a range of free and powerful profiling tools for analyzing and optimizing your code, both in-Editor and on hardware. The Unity Profiler is the most comprehensive element in this toolbox, but different tools will help you dig deeper into specific parts of the performance of your project on various platforms. Go to documentation for an overview and get our Ultimate guide to profiling Unity games for more context.
To access the Unity Profiler window, go to menu: Window > Analysis > Profiler. Profiling Core APIs, Memory Profiler and Profile Analyzer are available as packages through the Package Manager. See more information in documentation.
The Unity Profiler is instrumentation-based. A good balance of detail vs overhead is struck by markers being set in most of the Unity API surface. Important native functionality and scripting code base message calls are instrumented to capture the most important “broad strokes” without incurring too much overhead.
We recommend that you define a memory budget for parts of your projects, like shaders or textures, based on your game’s target platform’s hardware resources. The Memory Profiler will then help you inspect the memory footprint of each category, identify memory leaks and sources of continuous memory allocations.
The Memory Profiler is a pre-release package, which means it’s slated to be verified in Unity 2022 LTS. See documentation for more information on package states and lifecycles.